
Earnings are super important.
Investors will be looking for insights on industry trends, the economy, and of course the company’s outlook.
When companies report their earnings investors should focus on:
1. Did earnings meet or beat the market’s expectations (derived from the company’s previous guidance and analysts estimates)?
2. If there was a shortfall, was it a one-time event or something that will affect company performance over subsequent quarters?
3. Did the company offer positive guidance for the next quarter?
The “perfect storm” occurs when companies beat earnings expectations; provide positive guidance over that given previously for subsequent quarters; and analysts who follow the company upgrade their earnings expectations (and in some cases the target price). This is a good time to be owning that company’s shares.
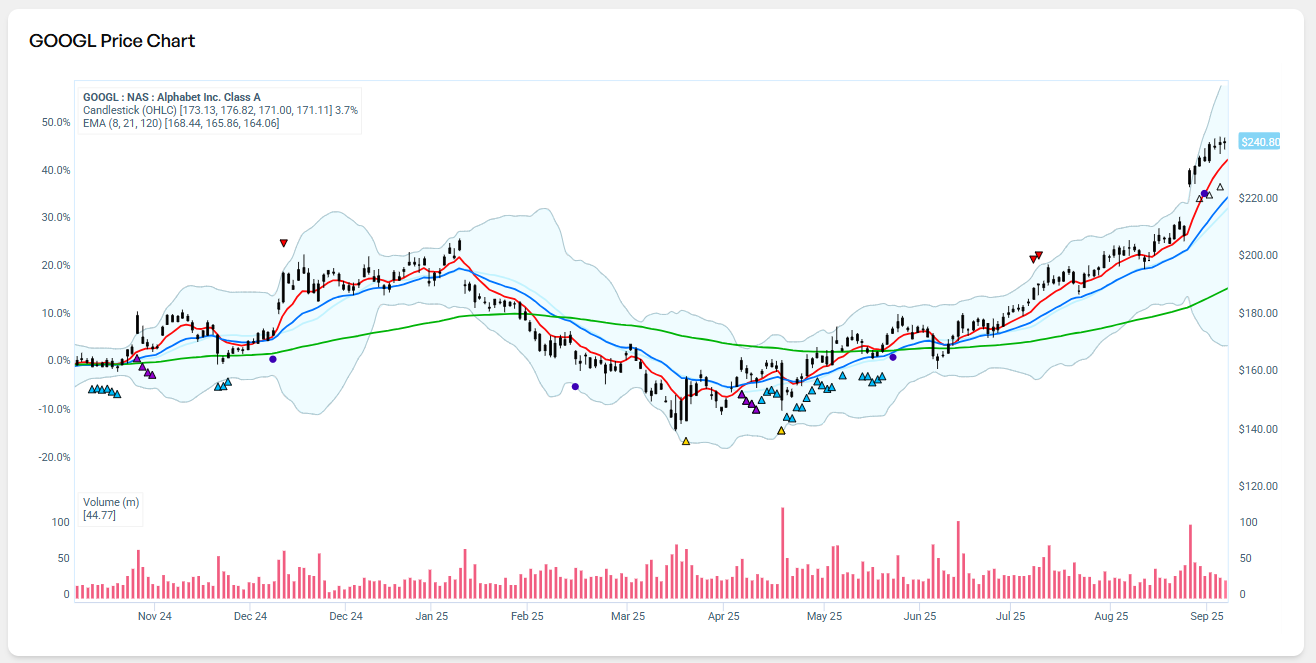
Alphabet (GOOGL)
Alphabet reported 2Q 2022 earnings. Here’s a summary:
Earnings per share (EPS): $1.21 vs $1.28 expected. A bit light.
Revenue: $69.69 billion vs $69.9 billion expected. Pretty much in line.
YouTube advertising revenue: $7.34 billion vs. $7.52 billion expected. YouTube’s ad growth was relatively meager, but better than last quarter.
Google Cloud revenue: $6.28 billion vs. $6.41 billion expected. A bit light but still up 35% Y/Y.
Traffic acquisition costs (TAC): $12.21 billion vs $12.41 billion expected.
Still, total advertising revenue climbed 12% from the previous year to $56.3 billion, narrowly surpassing analyst expectations of $55.9 billion. This shows the resilience of search advertising.
On a call with Bloomberg TV, CFO Ruth Porat says the company is “pleased with growth” during the quarter, citing ad spending in travel and retail, Google’s normal stalwarts.
Porat also said YouTube’s numbers reflected some advertiser uncertainty. Still, revenues are up sequentially and Y/Y.
Google’s sales reflected “elevated consumer online activity and broad-based strength in advertiser spend,” Chief Financial Officer Ruth Porat said in the statement.
A solid report considering the economic environment we are in.
Google shares rose as much as 5.5% in after-hours trading.
Alphabet is held in multiple thematic portfolios or “Vues: Social Media, Artificial Intelligence, Tech Stars, Perennial Millennials, and Disruptive Technologies
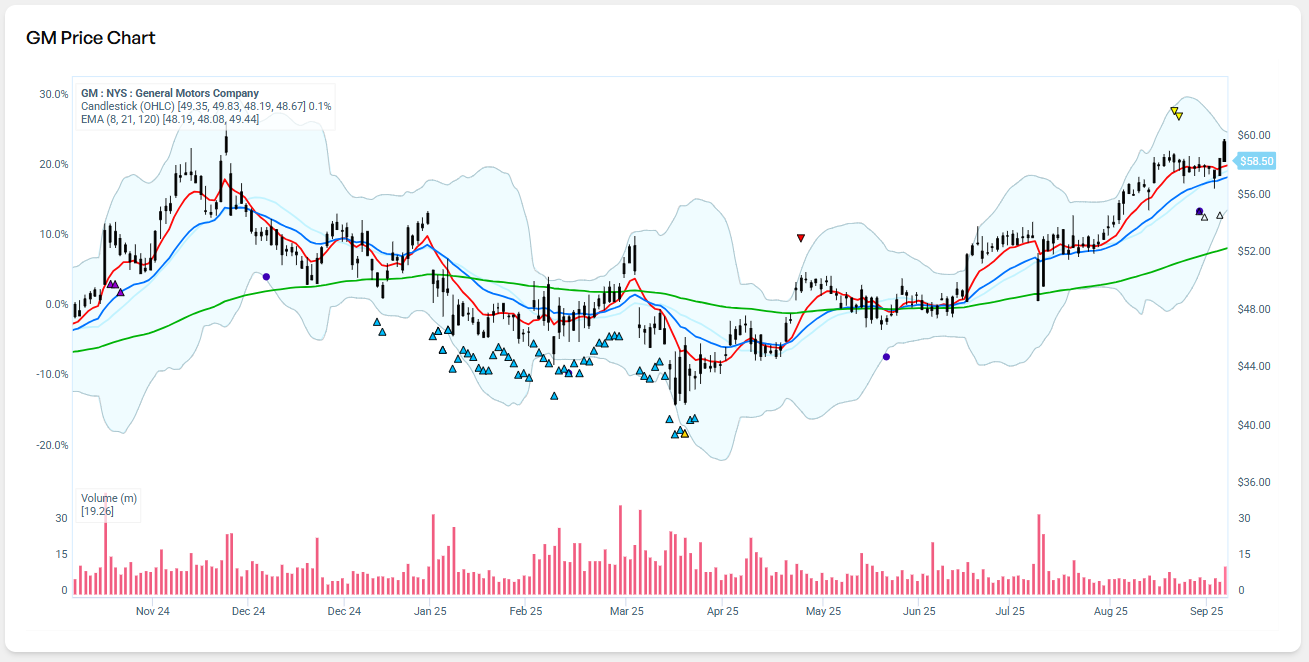
GM (GM)
GM reported 2Q 2022 earnings. Here is a summary:
Adjusted earnings per share: $1.14, versus $1.20 expected and $1.97 in the second quarter of 2021. Bit light.
Revenue: $35.76 billion, versus $33.58 billion expected and $34.17 billion in the second quarter of 2021. Better there.
EBIT-adjusted: $2.34 billion, versus $4.12 billion in the second quarter of 2021.
EBIT-adjusted margin: 6.6%, versus 11.2% in the first quarter of 2022 and 12.0% in the second quarter of 2021.
Mary Barra, GM CEO explains the shortfall.
“We have been operating with lower volumes due to the semiconductor shortage for the past year, and we have delivered strong results despite those pressures,” Barra said. “There are concerns about economic conditions, to be sure. That’s why we are already taking proactive steps to manage costs and cash flows, including reducing discretionary spending and limiting hiring to critical needs and positions that support growth.
“We have also modeled many downturn scenarios and we are prepared to take deliberate action when and if necessary,” she said.
In terms of guidance and more important in our view:
Barra said that GM is still confident that it will meet its previous guidance for the full year. The company expects net income of between $9.6 billion and $11.2 billion for 2022.
GM is held in HALO Technologies “Car of the Future” thematic portfolio or “Vue”
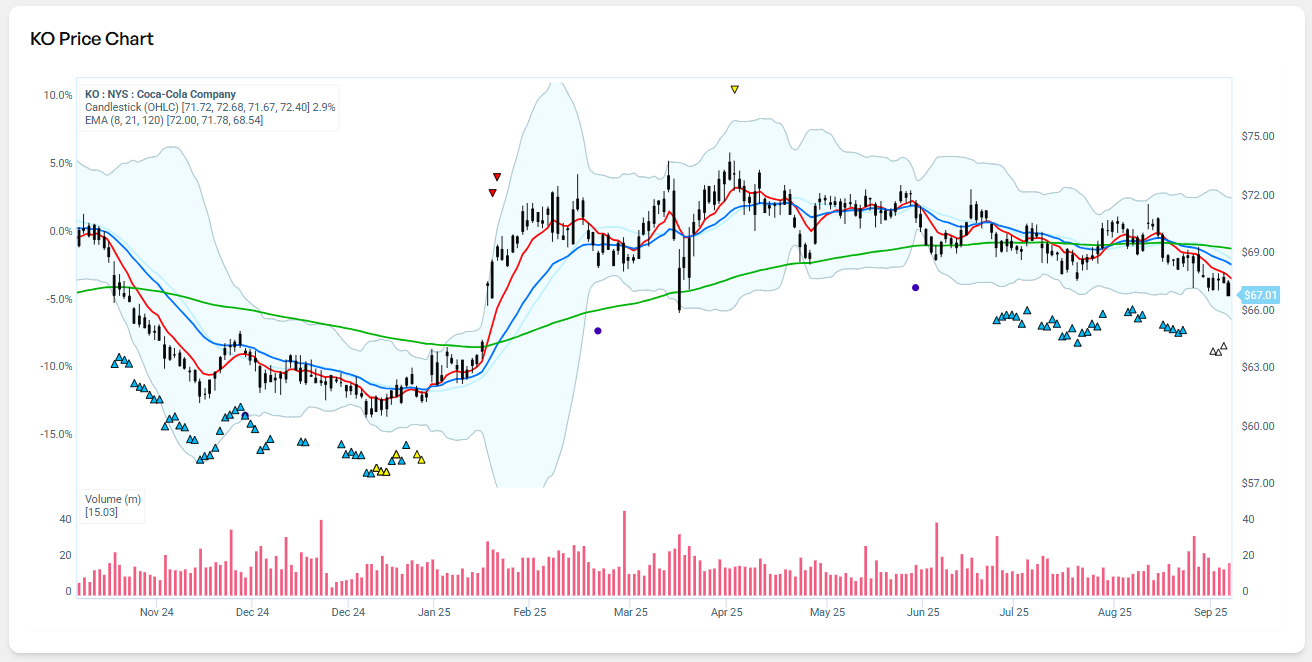
Coca Cola (KO)
Coca Cola’s Q2 FY2022 revenue was $11.3B, up 11.9% Y/Y, which beat analyst estimates by $730M.
Organic revenue was strong across operating segments and included 12% growth in price/mix and 4% growth in concentrate sales. Unit case volume rose 8% with performance driven by continued recovery in away-from-home channels.
The operating environment continues to be asynchronous with some regions experiencing broad-based strength while others being affected by strong inflationary pressures and pandemic-related lockdowns.
Earnings per share was $0.70, a 4% increase Y/Y, which beat analyst estimates by $0.03.
“Our results this quarter reflect the agility of our business, the strength of our streamlined portfolio of brands, and the actions we’ve taken to execute for growth in the face of challenges in the operating and macroeconomic environment,” said James Quincey, Chairman and CEO
Comparable operating margin was 30.7% versus 31.7% in the prior year. The decline in the margin was primarily driven by strong topline growth which was more than offset by the impact of the BODYARMOR acquisition, higher operating costs and an increase in marketing investment and currency headwinds.
Market share was gained in total nonalcoholic ready-to-drink (NARTD) beverages and consumer elasticities has been better-than-expected up until this point in the year but management is monitoring this closely as the average cost of the consumer basket continues to rise.
For the outlook for the full year 2022, as consumer environment is expected to be more challenging, management is preparing accordingly. Revenue growth of 6% to 7% is expected to be delivered with earnings per share growth of 5% to 6% against the $2.32 delivered last year. In constant currencies, revenue growth of 12% to 13% and earnings per share growth of 14% to 15% is anticipated.
Coca-Cola is held in our "Warren Buffett Top 10" thematic portfolio or “Vue”
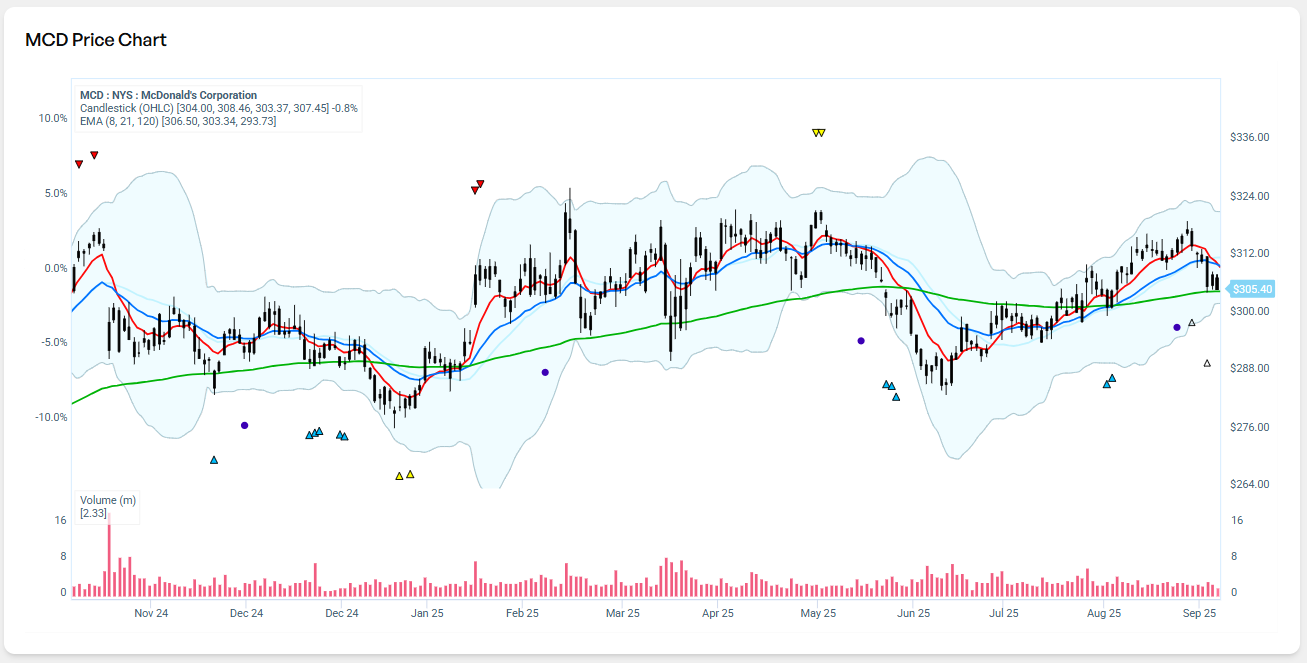
McDonalds (MCD)
McDonald’s Q2 FY2022 revenue was $5.72B, down 2.9% Y/Y, which missed analyst estimates by $100M.
Adjusted earnings per share was $2.55, up 15% Y/Y in constant currency, which beat expectations by $0.08. The adjustment included a $1.2B charge that the company received from the exit out of Russia and a $270M gain from the sale of Dynamic Yield.
Global comparable sales increased 9.7% Y/Y with positive growth across all segments. The U.S. saw a 3.7% increase off of strategic menu price increases and value offerings. International Operated Markets rose 13% led by strength in France and Germany. International Developmental Licensed Markets increased 16% reflecting strength in Brazil and Japan but partially offset by China as restrictions took place.
Systemwide sales increased 4% and Digital Systemwide sales in the top six markets exceeded $6B, representing nearly a third of Systemwide sales.
General & Administrative costs increased 10% off of higher investment into technology and incremental expenses. Operating margins were hampered by significant commodity and wage inflation as well as rising energy costs. The inflationary pressures are expected to impact margins for the remainder of the year.
President and Chief Executive Officer, Chris Kempczinski stated “By focusing on our customers and crew, enabled by a rapidly growing digital capability, we delivered global comparable sales growth of nearly 10%. Nonetheless, the operating environment across the competitive landscape remains challenging. While we are planning for a wide range of scenarios, I am confident that our plans and people position McDonald’s to weather this environment better than others.”
McDonalds is held in our "High Quality" thematic portfolio or “Vue”
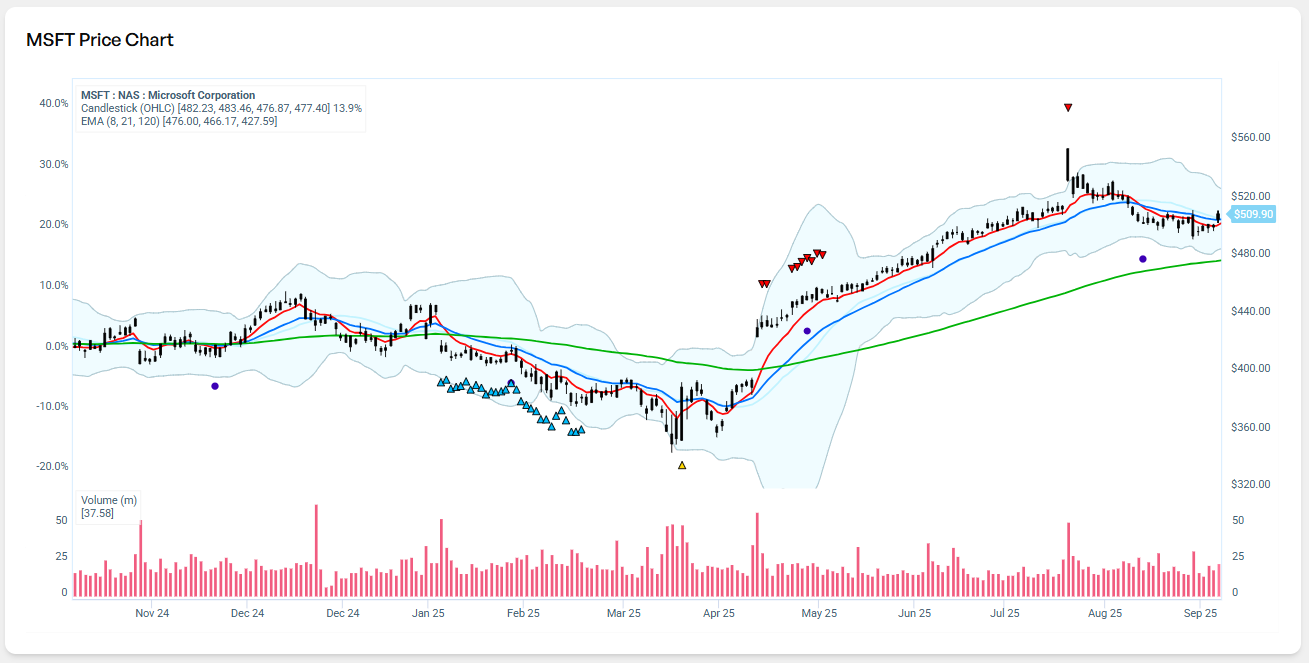
Microsoft Corp. (MSFT)
Microsoft Corp. reported fiscal Q4 (the June-ended Quarter) EPS of $2.23 on revenue of $51.87B (+12% YoY or 16% in constant currency), slightly missing consensus by 2.6% and 1%, respectively, hurt by a stronger dollar, slowing sales of PCs, lower advertiser spending and production shutdowns in China in May. The market sentiment reversed and the share price rallied in after-hours trading after the company issued its guidance for the full year on the earnings call.
Revenue in Productivity and Business Processes was $16.6 billion and increased 13% (up 17% in constant currency) driven by LinkedIn (+26% Y/Y), Dynamics products and cloud services (19% Y/Y), Office Commercial (+9% Y/Y) and Office Consumer (+9% Y/Y).
Revenue in Intelligent Cloud was $20.9 billion and increased 20% (up 25% in constant currency) primarily driven by Azure and other cloud services (+40% Y/Y or up 46% in constant currency) within the Server products and cloud services subsegment (+22% Y/Y).
Revenue in More Personal Computing was $14.4 billion and increased 2% (up 5% in constant currency) driven by Windows Commercial, Search and news advertising and Surface partially offset by Windows OEM revenue (-2% Y/Y) and Xbox content and services (-6% Y/Y).
Unearned revenue was $48.4B (+9.7% Y/Y).
Gross margin was relatively flat at 68.6% vs 68.9% a year ago. Operating margin expanded 70bps to 42.3%.
Microsoft returned $12.4 billion to shareholders through share repurchases ($7.8 bn) and dividends ($4.6 bn)during the quarter, an increase of 19% Y/Y.
“We see real opportunity to help every customer in every industry use digital technology to overcome today’s challenges and emerge stronger,” said Satya Nadella, chairman and chief executive officer of Microsoft. “No company is better positioned than Microsoft to help organizations deliver on their digital imperative – so they can do more with less.”
“In a dynamic environment we saw strong demand, took share, and increased customer commitment to our cloud platform. Commercial bookings grew 25% and Microsoft Cloud revenue was $25 billion, up 28% year over year,” said Amy Hood, executive vice president and chief financial officer of Microsoft. “As we begin a new fiscal year, we remain committed to balancing operational discipline with continued investments in key strategic areas to drive future growth.”
Looking ahead, sales and operating income for the new fiscal year on a currency-adjusted basis should increase by a double-digit percentage and margins will remain roughly flat, Chief Financial Officer Amy Hood said on the earnings call.
Ms. Hood also said the company would "slow the rate of hiring to focus on key growth areas."
Microsoft Corp. is held in our “High Quality”, “Video Games and E-sports” and “Tech Stars” thematic portfolios or “Vues”
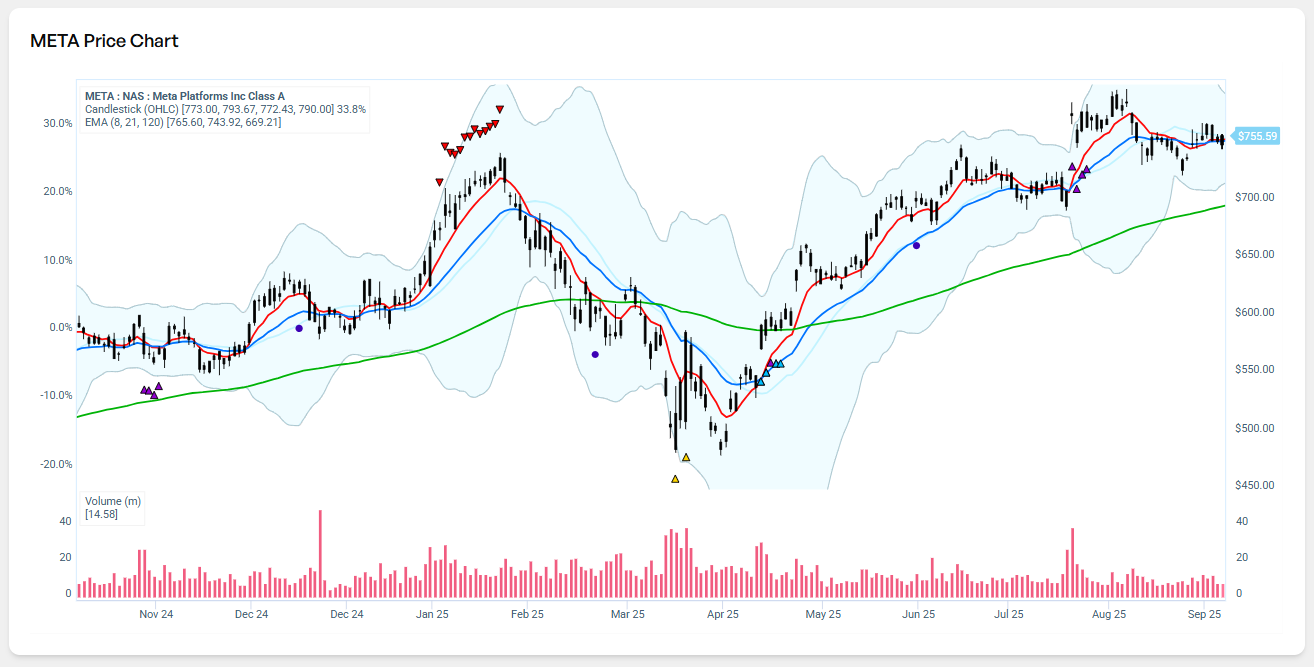
Meta (META)
Meta’s Q2 FY2022 revenue was $28.8B, down 1% Y/Y, with the result missing analyst estimates of $28.9B by $130M.
CEO Mark Zuckerberg said "Engagement trends on Facebook have generally been stronger than we anticipated and strong reel growth is continuing to drive engagement across Facebook and Instagram. That said, we seem to have entered an economic downturn that will have a broad impact on the digital advertising business. And it's always hard to predict how deep or how long these cycles will be, but I'd say that the situation seems worse than it did a quarter ago."
By segment, the Family of Apps revenue was $28.37B (-1.4% Y/Y) while Reality Labs generated $0.45B (+48.2 Y/Y).
Expenses increased 22.5% to $20.46B with Research and Development (+42.6% to $8.7B) and General & Administrative (+52.7% to $2.99B as headcount increased 32% Y/Y) contributing most towards the rise.
Net income declined 36% from $10.39B to $6.69B which equates to an earnings per share of $2.46, missing expectations by $0.09.
In the quarter ad impressions across Meta’s family of apps increased 15% Y/Y while average price per ad decreased 14%.
Metrics for June 2022, were as follows:
Family daily active people (DAP) was 2.88B, a 4% increase Y/Y.
Family monthly active people (MAP) was 3.65B, a 4% increase Y/Y.
Facebook daily active users (DAUs) were 1.97B, a 3% increase Y/Y.
Facebook monthly active users (MAUs) were 2.93B, a 1% increase Y/Y.
Family average revenue per person (ARPP) was $7.91, down 5.4% Y/Y, while
Facebook average revenue per user (ARPU) declined 3% to $9.82.
"It was good to see positive trajectory on our engagement trends this quarter coming from products like Reels and our investments in AI," said Mark Zuckerberg, "We're putting increased energy and focus around our key company priorities that unlock both near and long term opportunities for Meta and the people and businesses that use our services."
For Q3 outlook, revenue is expected to range from $26B to $28.5B (versus $30.4B consensus estimate) which reflects a continuation of the weak advertising demand environment that was experienced in Q2. Reality Labs revenue is to be lower than Q2. To account for the future operating environment, Meta will reduce hiring and expense growth for the year with total expenses to range from $85B to $88B which was lowered from the previous guidance of $87B to $92B.
Meta’s share price fell 4.5% in aftermarket trading following the announcement of the results.
Meta is held in the “Social Media” thematic portfolio or “Vue”
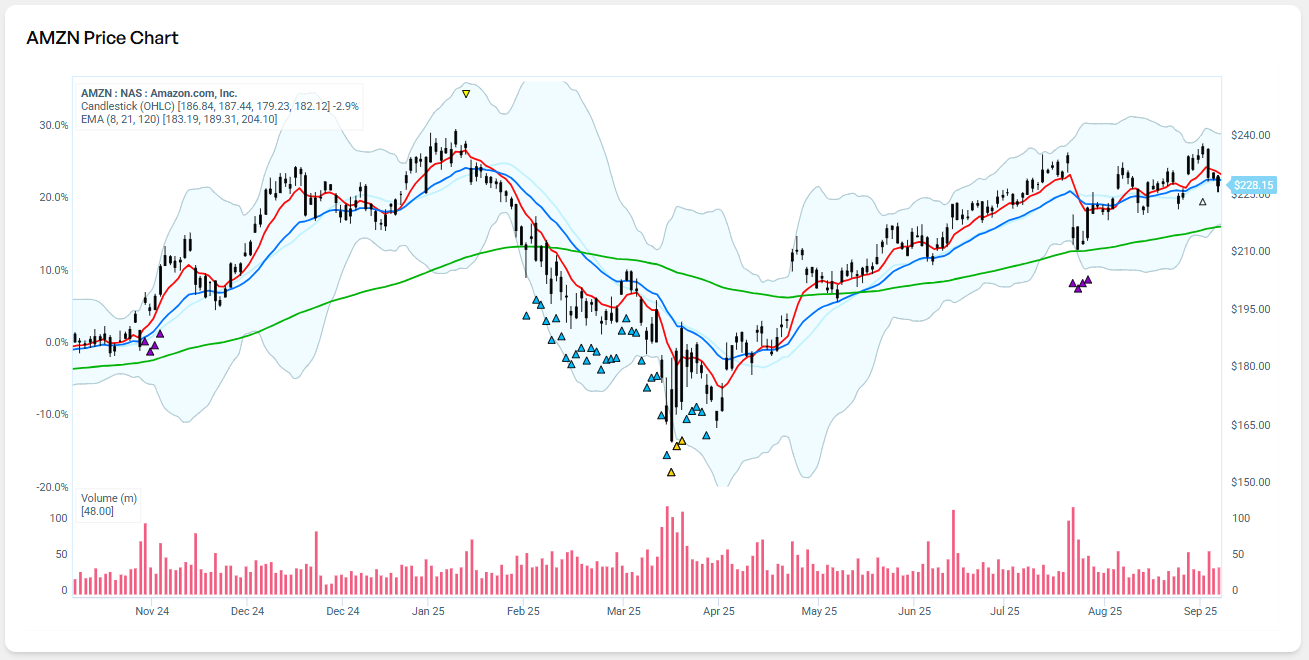
Amazon (AMZN)
Amazon results: The most important number.
Amazon 2Q Net Sales $121.2B up 7%. The consensus was $119.53B so nicely ahead. The company said that adjusted for a $3.6 billion headwind for unfavorable foreign exchange rates, sales would have been up 10% in the quarter. Amazon is not a Walmart.
On a GAAP basis, the company lost $2 billion in the quarter, or 20 cents a share, including a $3.9 billion non-operating expense related to the company’s stake in electric truck manufacturer Rivian Automotive.
Amazon Web Services, the company’s cloud computing arm, grew 33% in the quarter, pretty well in line with Wall Street estimates, to $19.7 billion. Online stores sales were a little lighter than expected, down 4%, to $50.9 billion, but flat adjusted for currency. Physical store sales were up 12%, to $4.7 billion. Third-party seller services revenue was $27.4 billion, up 9%. Subscription services revenue was $8.7 billion, up 10%. Advertising revenue was up 18%, to $8.8 billion.
Product sales in the quarter were $56.6 billion, down 2.4%. However, services sales were $64.7 billion, up 17%.
Subscription Services (Prime) grew 14% to $8.72 billion, reversing three consecutive quarters or slowing growth. That’s important as it shows Amazon can keep attracting new Prime members who spend a lot more than regular shoppers.
Advertising services grew 18% this quarter to $8.76 billion, after a 23% jump last quarter. Analysts expected $8.6 billion, so that’s another beat.
Fulfillment expenses increased 14% in the second quarter to $20.3 billion, less than analysts projected. Also, a positive. The company is executing well.
And cost of sales decreased to $66.4 billion from $66.5 billion in the first quarter. Amazon is keeping a lid on costs in a tough environment.
In terms of guidance, for the third quarter, Amazon is projecting sales of between $125 billion and $130 billion; at the midpoint that is slightly above the Wall Street consensus of $126.7 billion. The company sees operating income for the quarter of between zero and $3.5 billion, falling short of consensus at $4.4 billion.
Analysts, on average, projected a profit of $3.83 billion on sales of $127 billion, according to data compiled by Bloomberg. Guidance always a bit messy with Amazon.
“Despite continued inflationary pressures in fuel, energy, and transportation costs, we’re making progress on the more controllable costs we referenced last quarter, particularly improving the productivity of our fulfillment network,” CEO Andy Jassy said in a statement.
In the conference call, Amazon stated that capital spending will shift to technology infrastructure to support AWS and amount to half of all capital investments in 2022, while Amazon moderates fulfillment and transportation expenses to support the retail side of the business.
Amazon Web Services: The jewel in the crown. Up 33% in the quarter.
Amazon is held in multiple of our thematic portfolios: “Artificial Intelligence”, “Disruptive Technologies”, and “Perennial Millennials”
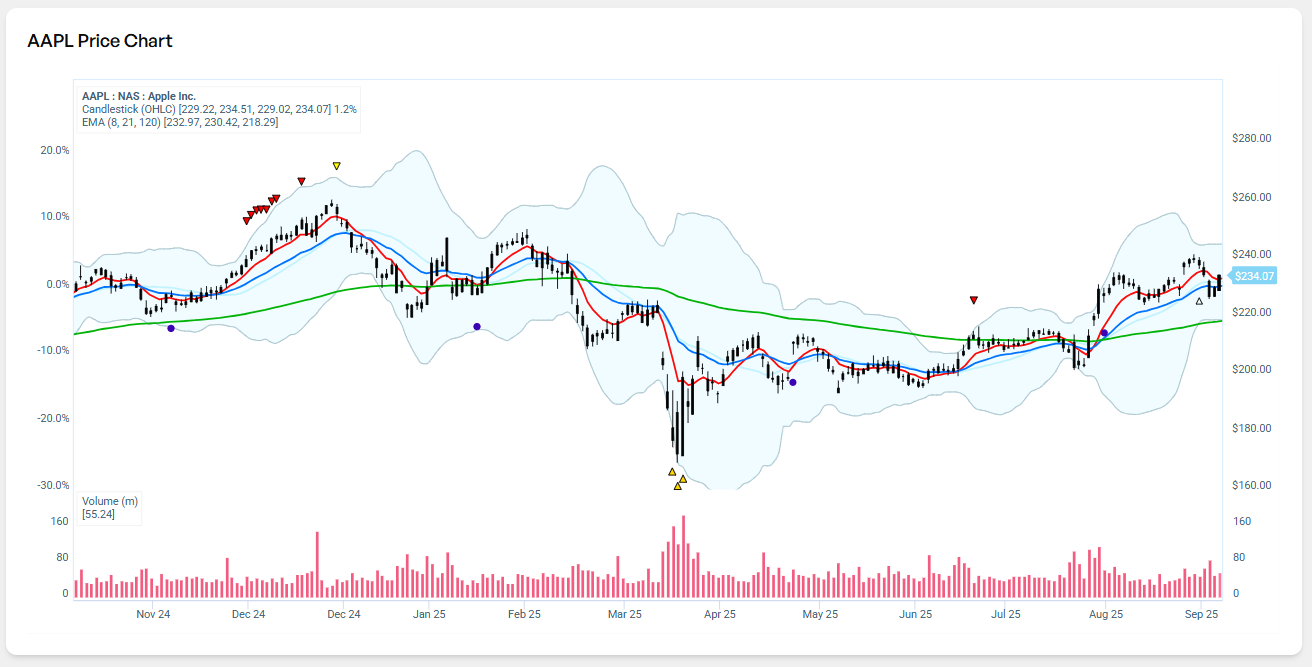
Apple (AAPL)
Apple’s Q3 FY2022 revenue was $82.96B, up 1.9% Y/Y, which was in-line with analyst estimates.
“Our June quarter results continued to demonstrate our ability to manage our business effectively despite the challenging operating environment. We set a June quarter revenue record and our installed base of active devices reached an all-time high in every geographic segment and product category,” said Luca Maestri, Apple’s CFO.
The results were better than management had expected despite supply constraints (although less than anticipated), foreign exchange headwinds (over 300 basis points) and the impact of the business in Russia.
Emerging markets performed well with double-digit growth in Brazil, Indonesia and Vietnam and a near doubling of revenue in India.
Net income was $19.4B which equates to an earnings per share was $1.20 which beat estimates by $0.05.
Revenue breakdown by segments:
• IPhone: $40.67B, up from $39.57B or 2.8% Y/Y with customer response to the iPhone 13 continuing to be strong and there was a record number of switchers to the brand with double-digit Y/Y growth.
• IPad: $7.22B, down from $7.37B or 2.0% Y/Y, due to supply constraints and a negative foreign exchange impact.
• Mac: $7.38B, down from $8.24B or 10.4% Y/Y, as the devices were impacted by supply constraints and a negative foreign exchange impact.
• Wearables, Home, and Accessories: $8.08B, down from $8.7B or 7.1% Y/Y, as they faced foreign exchange headwinds, different launch timings for home and accessories products, supply constraints and an overall tougher macroeconomic environment.
• Services: $19.6B, up from $17.48B or 12.1% Y/Y, despite an almost 500 basis point headwind from foreign exchange as well as impacts from their business in Russia and the macroeconomic environment.
The Services performance reflects strength in the ecosystem and the continual growth in the install base which reached an all-time. Customer engagement grew in the area with transacting accounts, paid accounts, and accounts with paid subscriptions all growing double-digits Y/Y. There are more than 860M paid subscriptions across the services on the platform with over 160M gained in the last twelve months.
Specific revenue guidance numbers were not provided given the uncertainty around the world but management believes based on current conditions, given they do not worsen, Y/Y revenue will accelerate during the September quarter despite an approximately 600 basis point impact from foreign exchange. Lower supply constraints are expected for the product side of the business when compared to Q3 but for services, revenue is expected to grow but decelerate from the June quarter due to macroeconomic and foreign exchange factors.
Although some products saw Y/Y declines, investors enjoyed the news and the positive outlook with shares for Apple increasing 3% in after-market trading.
Apple is held in the “Luxury Goods”, “Perennial Millennials”, “Tech Stars” and the “Warren Buffet Top 10” thematic portfolios or “Vues”.
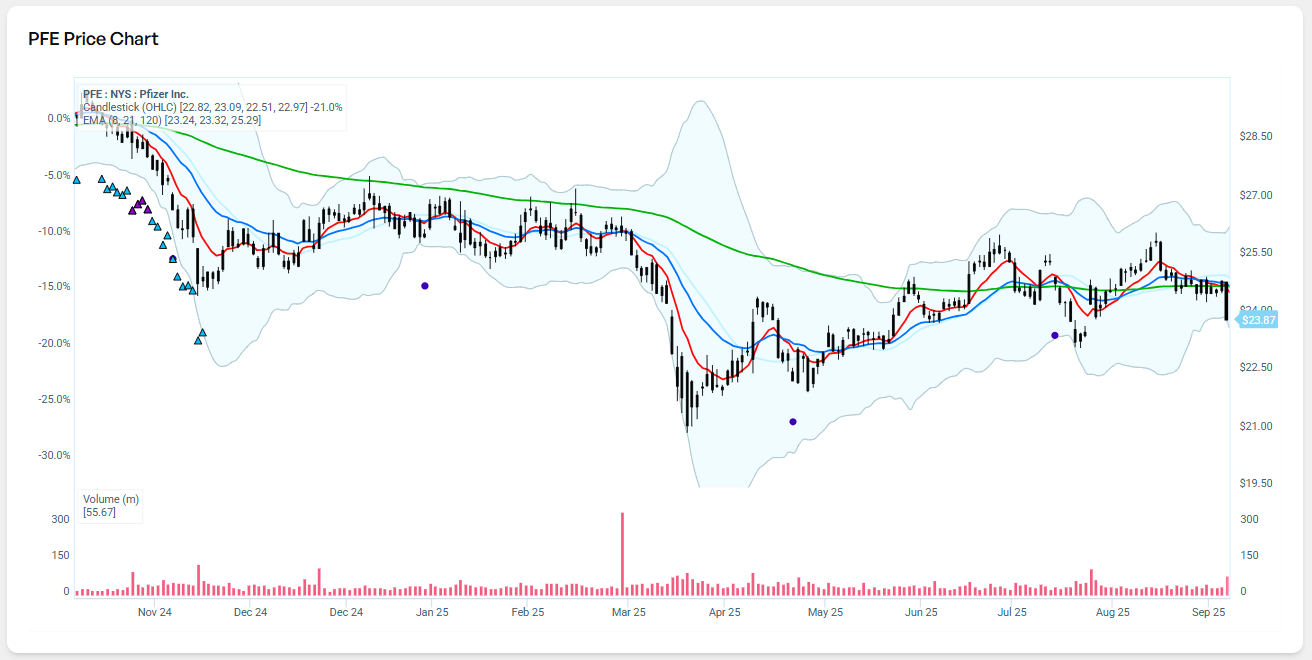
Pfizer (PFE)
Group sales in Q2'22 increased 47% to $27,742 million and came ahead of consensus expectations (consensus: $25,700 million). The primary driver of this strong result was robust contributions from Paxlovid and Comirnaty (its Covid-19 vaccine and antiviral). At the segment level, sales for Vaccines increased +20%, Hospital was flat, +1% Oncology, +5% Internal Medicine, and -14% Inflammation & Immunology.
SI&A expenses increased 7% in Q2 compared to the prior-year quarter, driven by higher investments for Paxlovid and Comirnaty. R&D expenditure increased 27% compared to the prior-year quarter, driven by investments in late-stage clinical programs.
Group reported net income increased 78% to $9,906 million (Q2’21: $5,563 million) and diluted EPS increased 77% to $1.73 (Q2’21: 77%).
Looking at capital allocation for the Group, in the first half, $4.5 billion was spent in cash dividends, and $2 billion was utilized to repurchase 39.1 million shares.
Guidance for 2022 has been increased for revenues and adjusted diluted EPS by approximately $2,000 million and $0.24 cents, respectively. The guidance range for revenues remains unchanged.
Pfizer is held in the "High Quality" thematic portfolio or "Vue."
Important Information
All information contained in this publication is provided on a factual or general advice basis only and is not intended or be construed as an offer, solicitation, or a recommendation for any financial product unless expressly stated. All investments carry risks and past performance is no indicator of future performance. Before making an investment decision, you should consider your personal circumstances, objectives and needs and seek a professional investment advice. Opinions, estimates and projections constitute the current judgement of the author as at the date of this publication. Any comments, suggestions or views presented in this communication are not necessarily those of HALO Technologies, Macrovue or any of their related entities (‘we’, ‘our’, ‘us’), nor do they warrant a complete or accurate statement.
The opinions and recommendations in this publication are based on a reasonable assessment by the author who wrote the report using information provided by industry resources and generally available in the market. Employees and/or associates of HALO Technologies or any of the other related entities may hold one or more of the investments reviewed in this report. Any personal holdings by HALO Technologies or any of the other related entities employees and/or associates should not be seen as an endorsement or recommendation in any way. HALO Technologies Pty Limited ACN 623 830 866 is a Corporate Authorised Representative CAR: 001261916 of Macrovue Pty Limited ACN:600 022 679 AFSL 484264. MacroVue Pty Limited is a wholly owned subsidiary of HALO Technologies Pty Ltd. These companies are related entities with Amalgamated Australian Investment Group Limited ABN 81 140 208 288 (AAIG).
.png)